Hyperparameter tuning is the process of finding the best set of hyperparameters for a deep neural network that optimizes its performance on a given task. The optimal hyperparameters can significantly impact the accuracy, speed, and stability of the model during training and inference.
There are various platforms that can help with hyperparameter tuning, including Grid Search, Random Search, and Bayesian optimization.
As far as I know these platforms and libraries is useful for hyperparameter tuning and optimization:
- GridSearchCV and RandomizedSearchCV from the scikit-learn library, which perform hyperparameter tuning through grid search and random search, respectively.
- Keras Tuner, a high-level API for Keras that provides various search algorithms, including grid search, random search, and Bayesian optimization.
- TensorFlow’s Keras Tuner, a high-level API for TensorFlow’s Keras API that provides various search algorithms, including grid search, random search, and Bayesian optimization.
- Talos, a library for hyperparameter tuning and model selection that supports both grid search and random search.
- Hyperopt, a library for hyperparameter tuning that uses Bayesian optimization techniques.
- Scikit-Optimize, a library for Bayesian optimization that includes various search algorithms, including grid search and random search.
- Optuna is an open-source platform for hyperparameter tuning that uses Bayesian optimization techniques to search for the best hyperparameters. Bayesian optimization models the uncertainty in the model’s performance and uses this information to guide the search for optimal hyperparameters. Optuna also provides an easy-to-use interface and supports parallel computation to speed up the hyperparameter tuning process.
Each of these platforms has its own unique features and algorithms, so it is important to choose one that best fits the needs of your project and problem
I personally use Optuna to optimize the deep learning hyperparameters, and it is very easy to set up and analyze the results after the optimizations.
Optuna in practice
Optuna gives PyTorch integration through the Optuna PyTorch integration library. With this integration, you can easily use Optuna for the hyperparameter tuning of your PyTorch models.
Here is a simple example of how you could use Optuna with PyTorch:
import torch
import optuna
from optuna.integration import PyTorchPruningCallback

def objective(trial):
    # Define the model architecture
    model = ...
    criterion = ...
    optimizer = ...

    # Define the hyperparameters to be tuned
    num_epochs = trial.suggest_int('num_epochs', 1, 10)
    learning_rate = trial.suggest_float('learning_rate', 1e-5, 1e-2, log=True)

    # Train the model
    model.train()
    for epoch in range(num_epochs):
        ...

    # Evaluate the model
    model.eval()
    ...
    return accuracy

study = optuna.create_study(direction='maximize')
study.optimize(objective, n_trials=100, callbacks=[PyTorchPruningCallback(trial, 'accuracy')])

best_params = study.best_params
best_accuracy = study.best_value
In this example, the objective function defines the model architecture, hyperparameters, and training process. Optuna is used to tune the num_epochs and learning_rate hyperparameters. The PyTorchPruningCallback is used to enable early stopping based on a certain metric (here, accuracy). The study.optimize method is used to run the hyperparameter tuning process with a specified number of trials. Finally, the best hyperparameters and accuracy are retrieved from the study.
Optuna also provides APIs for several machine-learning platforms, including TensorFlow, Keras, XGBoost, LightGBM, and CatBoost, in addition to PyTorch.
Here is an example of how you could use Optuna with TensorFlow’s Keras API:
import tensorflow as tf
import optuna

def objective(trial):
    # Define the model architecture
    model = tf.keras.models.Sequential()
    ...
    model.compile(...)

    # Define the hyperparameters to be tuned
    num_epochs = trial.suggest_int('num_epochs', 1, 10)
    learning_rate = trial.suggest_float('learning_rate', 1e-5, 1e-2, log=True)

    # Train the model
    model.fit(..., epochs=num_epochs, ...)

    # Evaluate the model
    accuracy = model.evaluate(...)
    return accuracy

study = optuna.create_study(direction='maximize')
study.optimize(objective, n_trials=100)

best_params = study.best_params
best_accuracy = study.best_value
In this example, the objective function defines the model architecture, hyperparameters, and training process. Optuna is used
to tune the num_epochs learning_rate Hyperparameters. The study.optimize the method is used to run the hyperparameter tuning process with a specified number of trials. Finally, the best hyperparameters and accuracy are retrieved from the study.
Similarly, you can integrate Optuna with other machine-learning platforms with Optuna’s APIs. For example, for XGBoost, you could use trial.suggest_float to specify the range of values for a hyperparameter, and for LightGBM, you could use trial.suggest_categorical to specify the possible values for a categorical hyperparameter.
Visualization and data analysis
Optuna provides visualization and dashboard features that allow you to inspect and analyze the results of your hyperparameter tuning experiments.
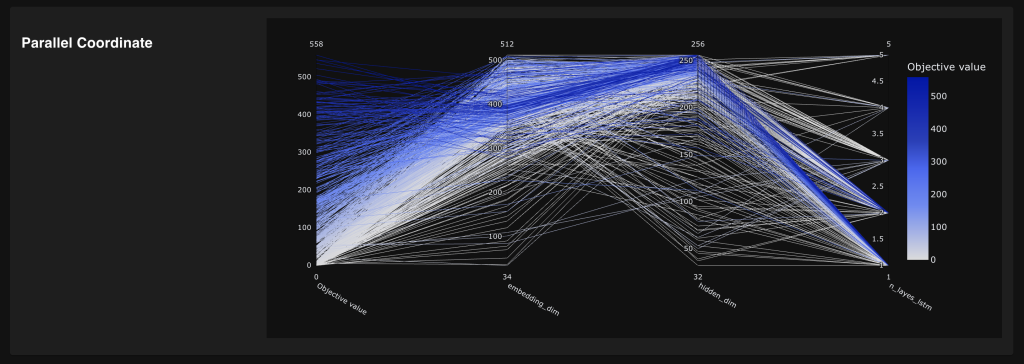
- Optuna visualization: Optuna provides built-in visualization functions that allow you to visualize the results of your hyperparameter tuning experiments. For example, you can visualize the relationship between the hyperparameters and the objective function using scatter plots, violin plots, and parallel coordinate plots. You can also visualize the convergence of the optimization process using line plots and histograms.
To use the visualization functions, you can simply call the desired function and pass in the study object that holds the results of your hyperparameter tuning experiments. For example:
import optuna

study = optuna.create_study()
study.optimize(objective, n_trials=100)

optuna.visualization.plot_parallel_coordinate(study)
- Optuna dashboard: Optuna provides a dashboard feature that allows you to view and analyze the results of your hyperparameter tuning experiments in a web-based interface. The dashboard provides a variety of visualizations and allows you to compare the results of multiple studies.
To use the dashboard, you can start an Optuna study and then run the study.get_trials_dataframe() method to get a Pandas DataFrame that holds the results of your hyperparameter tuning experiments. You can then pass this DataFrame to the optuna.visualization.show method to launch the dashboard.
Here is an example:
import optuna

study = optuna.create_study()
study.optimize(objective, n_trials=100)

df = study.trials_dataframe()
optuna.visualization.show(df)
The Optuna visualization and dashboard features allow you to gain insights into your hyperparameter tuning experiments and make informed decisions about your model and hyperparameters.
The optuna-dashboard has a tool for visualizing the results of your hyperparameter tuning experiments using Optuna. You can use it to load the results of your Optuna experiments and visualize the results in a web-based interface.
Here are the steps to use the optuna-dashboard to load hyperparameter tuning results:
- Install the optuna-dashboard: To use the optuna-dashboard, you need to install it first. You can do this by running the following command in your terminal:
pip install optuna-dashboard
- Store the study results: To use the optuna-dashboard, you need to store the results of your Optuna study in a database. You can do this by using the
study.set_user_attrmethod to store the study results as a user attribute.
import optuna

study = optuna.create_study()
study.optimize(objective, n_trials=100)
study.set_user_attrs({"results": study.trials_dataframe().to_dict()})
- Start the optuna-dashboard: To start the optuna-dashboard, you need to run the following command in your terminal:
optuna dashboard --storage sqlite:///example.db
Replace sqlite:///example.db with the appropriate database URL for your database.
- Load the study results: Once the optuna-dashboard is running, you can load the study results by visiting the dashboard in your web browser and selecting the study you want to view. The dashboard will display the results of the study, including information about the hyperparameters, objective function values, and the optimization progress over time.
By using the optuna-dashboard, you can easily visualize the results of your hyperparameter tuning experiments and gain insights into the behavior of your models and the impact of different hyperparameters on the performance of your models.
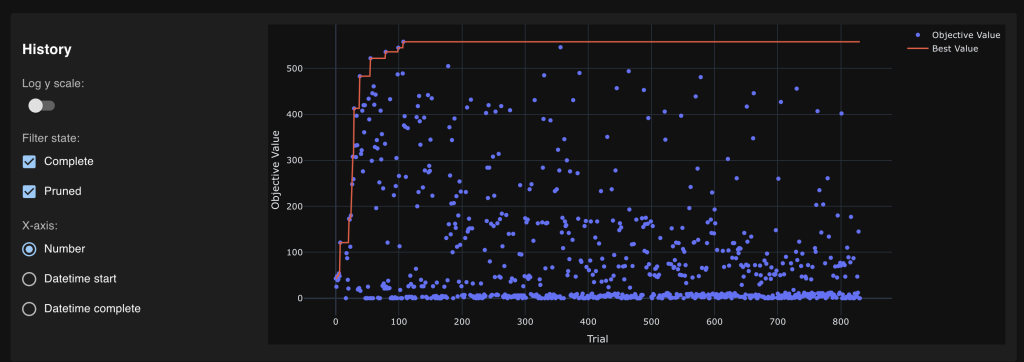
Some output from the Optuna dashboard
Finally
The advantages of using Optuna for hyperparameter tuning are:
- User-friendly API: Optuna provides a user-friendly API that makes it easy to define and run hyperparameter tuning experiments, even for users with limited programming experience.
- Integration with machine learning platforms: Optuna integrates well with popular machine learning platforms like TensorFlow, Keras, XGBoost, LightGBM, PyTorch, and CatBoost, which makes it easy to use Optuna for hyperparameter tuning of models built using these platforms.
- Sampling methods: Optuna provides various sampling methods, including random search, grid search, and Bayesian optimization, to search the hyperparameter space efficiently.
- Model selection and early stopping: Optuna provides built-in support for model selection and early stopping based on validation metrics, which can save computation time and resources.
- Scalability: Optuna can scale to large-scale hyperparameter tuning experiments and handle high-dimensional hyperparameter spaces.
However, some disadvantages of using Optuna for hyperparameter tuning are:
- Computational overhead: Running hyperparameter tuning experiments using Optuna can be computationally expensive, especially when using more sophisticated sampling methods like Bayesian optimization.
- Limited support for custom sampling methods: While Optuna provides several built-in sampling methods, users may not be able to use custom sampling methods if Optuna does not support them.
- Requires a GPU: Optuna requires a GPU to run some of its algorithms and may not be suitable for users who do not have access to a GPU.
In summary, Optuna is a useful tool for hyperparameter tuning, but its suitability for a particular use case will depend on the computational resources available and the specific requirements of the user.
For more information, you can access the Optuna documentation at this link: https://optuna.readthedocs.io/en/stable/tutorial/index.html. The documentation provides detailed instructions on how to use the Optuna optimization, visualization, and dashboard features and examples of using them with various models and data types.
Hope this post helps you learn about hyperparameter tuning in deep learning.
A presto